


Here’s a traditional map:

It is a map for travelling between cities and towns. Here’s a different kind of map, the government’s tourism photo of Kalamalka Lake, on the south shore of my city of Vernon and its twin city, Coldstream (in the lower image). It’s not for pathfinding. It uses colour and distance to entice.

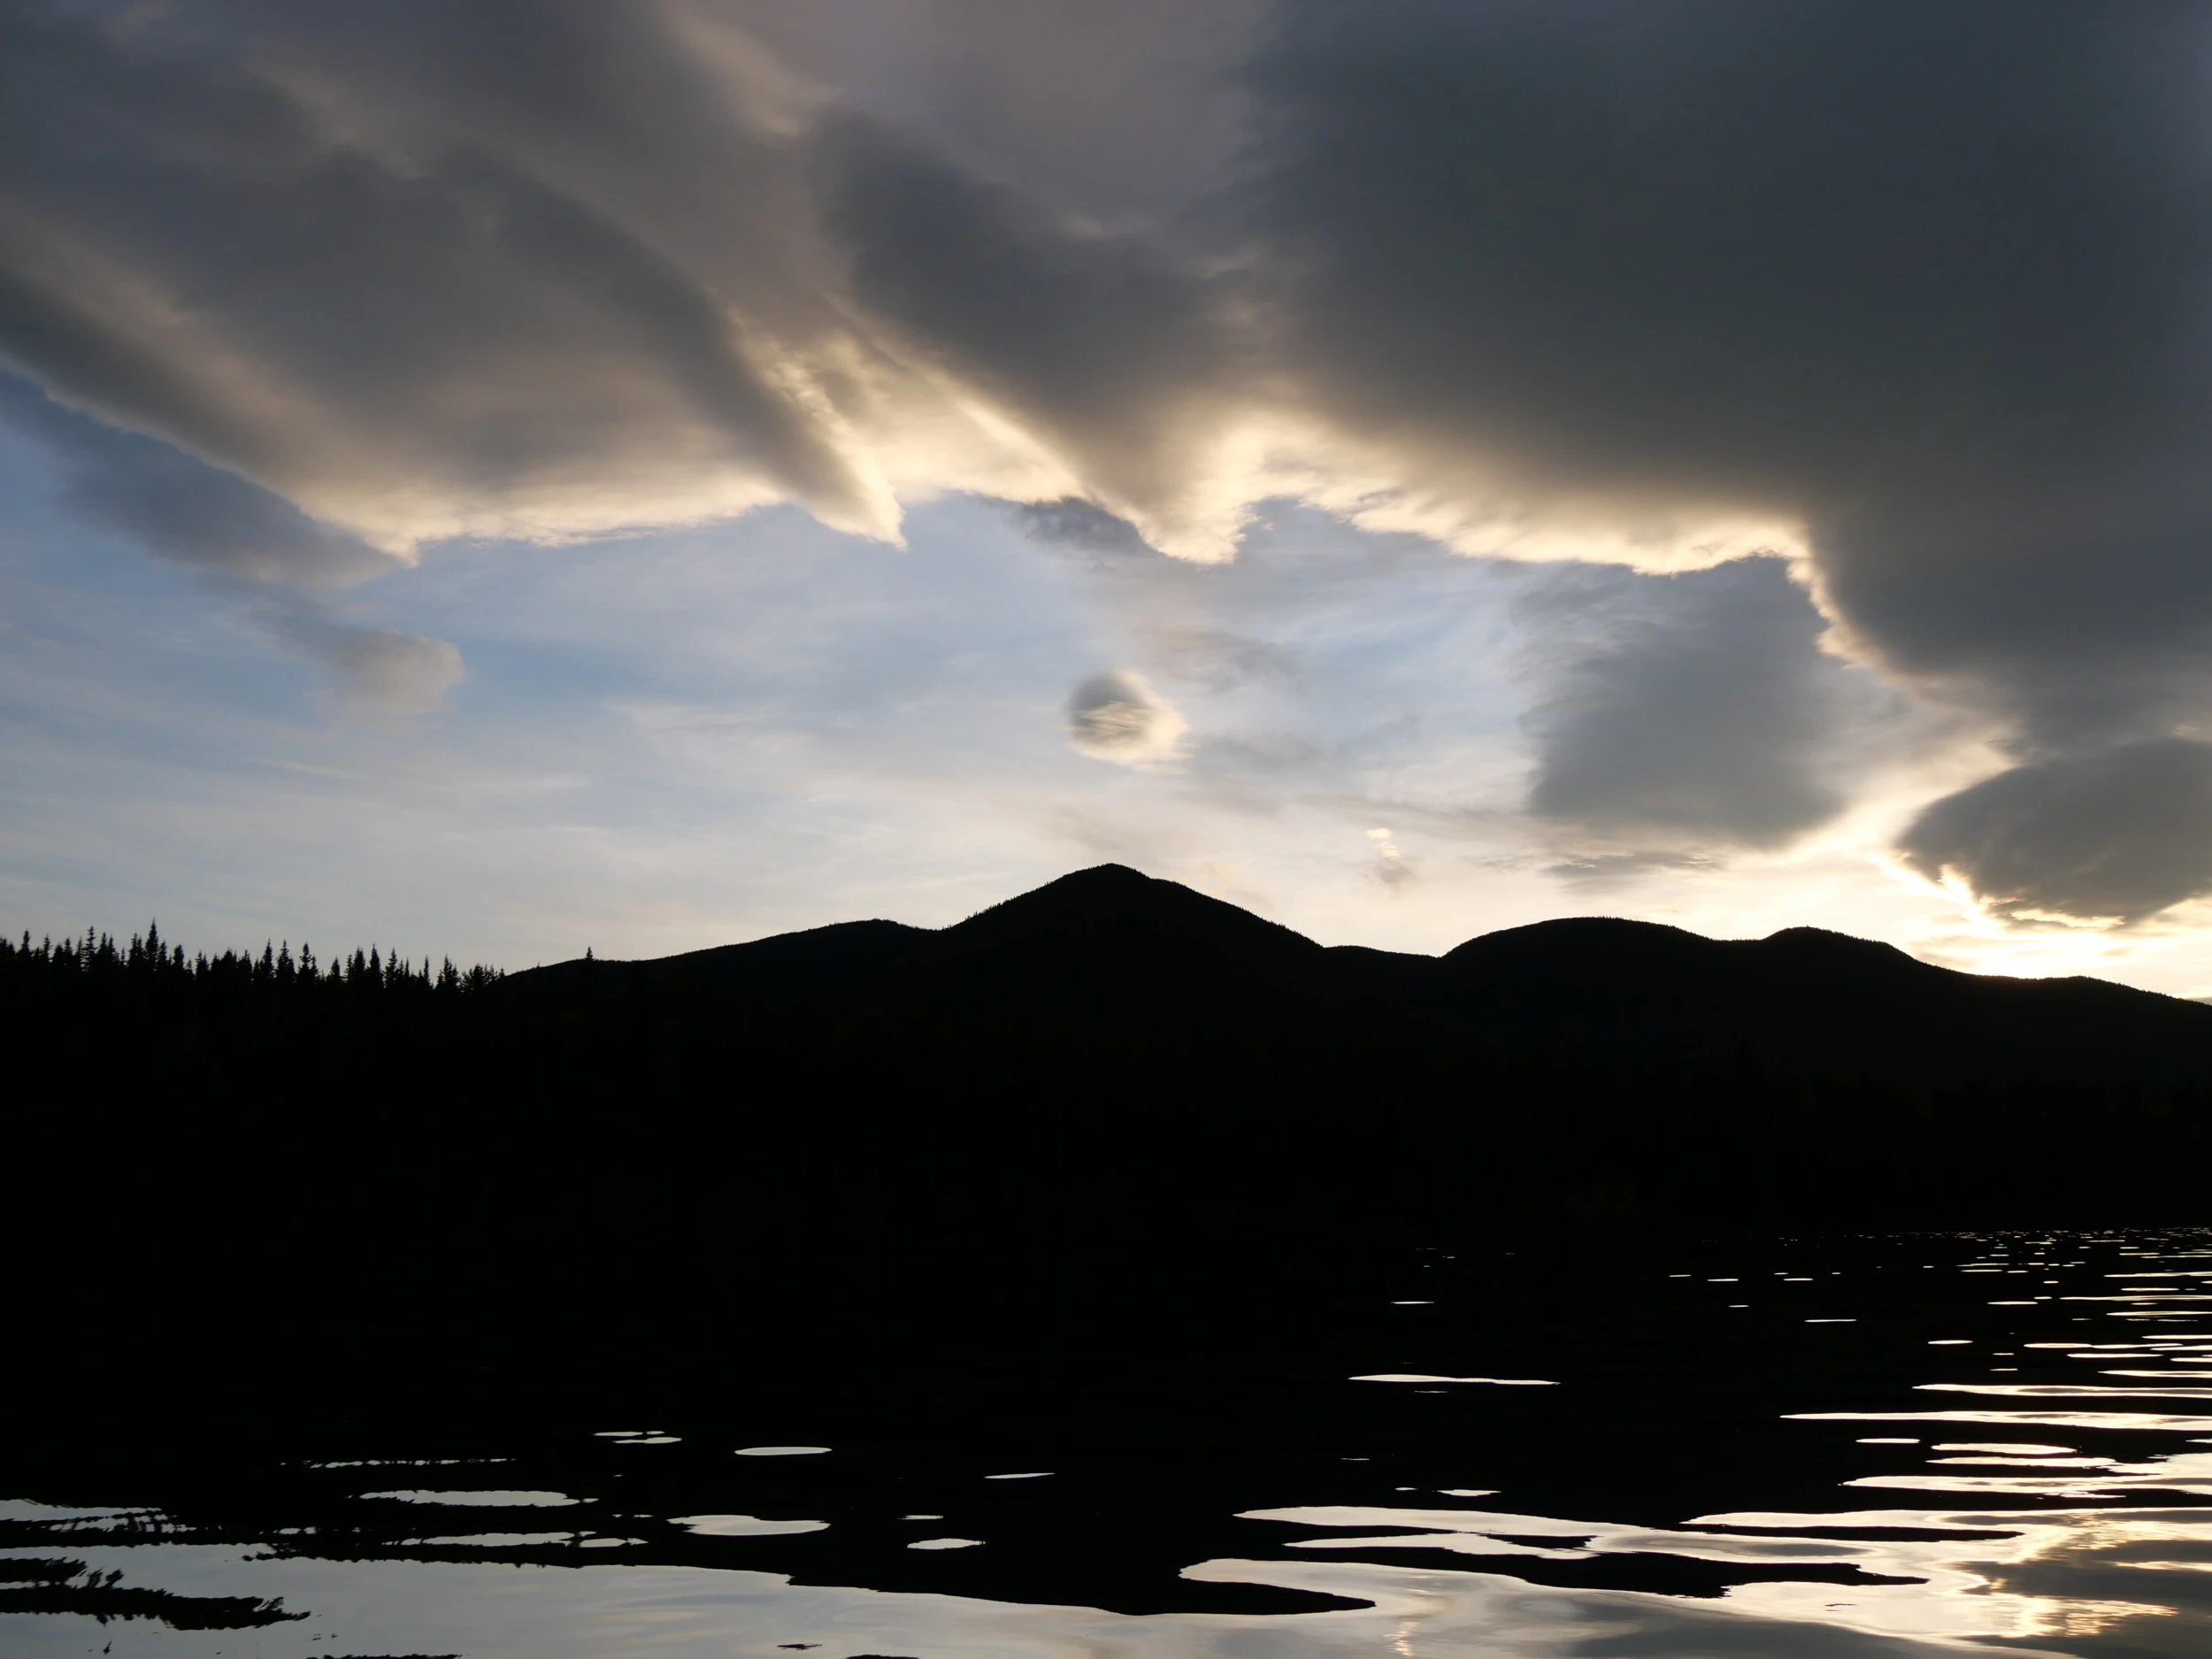
That’s Okanagan Mountain in the far distance, mid-image, on Okanagan Lake. Here too, but from the south west:

The lake is obviously prominent in such a map. Here it is from space.

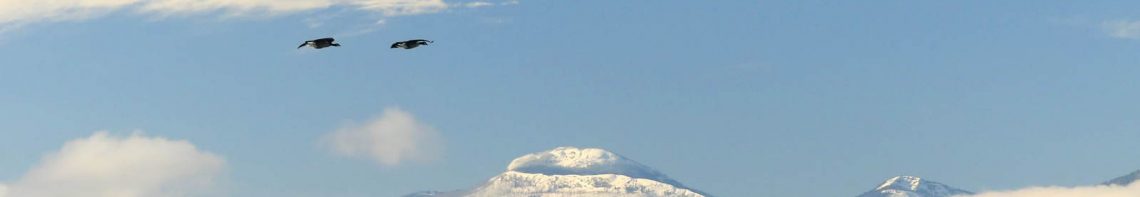
And below at the mouth of Vernon Creek on the edge of the Priest Valley Indian Reserve, where huge flocks of geese, gulls and mallards are currently huddling out the cold, much to the amusement of a few shy mergansers who don’t mind it.

This presents an interesting question: is the Okanagan a land or a water?

Life as Water (Green Water) Pooling on the Slopes of the Sun

Wind-Blown Land Pooling on the Slopes of the Water

Water Flowing Out of the Land Pooling Around Rocks Deposit by Water and Now Fallen Out Onto the Land
Well, both at once. At the moment, though, maps are land-based, such as:
Even when they contain water, well, the word says it: they “contain” water.

In fact, in most maps, land and water are considered the same thing: orienteering marks that allow one to enter development areas, or to show where these orienting marks are.

That’s hardly the point of land or water themselves. Still, this observation: What would a water-based map look like, one in which the land was contained by the water? Like this?

No, that’s an elevation map, showing at what elevations water lies. Useful, but it’s still a land map. What about this?
![]()
No, that’s another land-based map, as useful as it is. There’s a lot of maps like that. What about this, though?

Yeah, it’s another land-based map, but look at the little inset on the right. Here it is more dramatically:

Do you see that? Now the water and how it is woven with the land is contained with an indigenous story based upon human presence on and use of the land. The water is no longer contained by the land; both water and land are contained by a story. That is, of course, what traditional maps do as well…

… except in their case the story is the story of map-making and naming itself. It is tied neither to identity or language, but to continual exploration and settlement. And yet, the water shows quite a different story. Here at the mouth of Vernon Creek, for example, the land is good habitat for geese, on the edge of their world, and good support for humans, on the edge of theirs. It is a place of meeting. The water is not contained by the land, here. The land is contained by the water. The edges are most useful.

It suggests a map of edges. If we were to make that map, though, a map of the water that is in the air is vital, because the water on the land and in the land is a function of the water in the air. We are, truthfully, all of us, humans and geese, on the shore of the sky.

And, truthfully, there is more water up there than either in the lake or on the land.

It even has the ability to draw water out of the land and hold it in the air.
So, perhaps what would be most useful here was not a map of either water or air but a map of pressure. Perhaps there are a number of different ways of getting at that. Through a map of air pressure, of course:

Invaluable stuff, but it’s not going to help us find our way. There are also maps with wind and pressure together.

Crazy fun! Maps of this kind are commentary. Their story is not on the land itself and they can’t guide us on the land, only to understanding. Now, understanding is great, but what if we want to be guided into the land’s energy, as a pathfinding method? As a story? Well, we’d have to have the earth level, the sky level and the underground level of pressures, all at once. At this point, map-making gets a little crazy:

Everyone is trying something! What they all are, however, are teaching aids, for understandings that are not the experience of being on the land. They can help us enter it, but they’re poor maps. I’d say they illustrate the limitations of map-making as an art. But let’s go back a minute and just think about that. These understandings are largely in mathematical and statistical measurement and modelling, contained within understandings, which come to consciousness through words. In other words, using words we can make a kind of map. If that’s the case, can we make a map by looking at the winds? Here’s an earth wind map from February 5. Wind is pouring out of the Central Plateau onto the Coast and south from there.

The Okanagan is the upper part of the vertical wind in the dark blue area of the lower centre of the image. These winds, of course, change. Here they are on October 18. In this case, all of the Pacific Northwest, Yukon and Alaska are an eddy. The wind is out to sea.

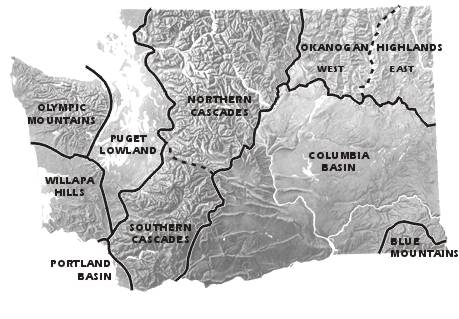
This is such a changeable kind of mapping that it’s not easily going to help us find our way. However, perhaps it can. After all, the land is reacting to these winds. Can we read these reactions? As David McCloskey of the Cascadia Institute teaches, yes we can. In 2015, he released a map of Cascadia, which includes the Okanagan, based on many principles, one of which was that the land would be coloured not randomly by altitude in hypsometric tints, like here…

… but according to specifically what vegetation grows on it, with colours chosen on the pattern of high=dark and low=light, to increase contrast. Note as well that the map includes the sea floor.

Here’s his explanation of that, on esri.com.
-
Vegetation: The major contribution of the new Cascadia map! Providing a seamless integrative cross-border coverage of Forest Types and other Land Cover in detailed 30 meter resolution; offers a new comprehensive region-wide Forest Framework of 27 major Forest & Woodland assemblages presented in the Legend, with each type’s abbreviation appearing in a color box—e.g. ICH—which is also pinned to its specific locations on the map for ready reference.
-
Legend: Along with other Land Cover, the contextual legend shows each forest type—e.g. ICH or “Interior Maritime Cedar-Hemlock”—in terms of: (a) its species composition, (b) in order of prevalence, (c) by geographic section—North, Center, South (which can be checked on separate species distribution maps), for (d) both conifer and broadleaf trees. This innovative Legend sets a new standard.
-
Key: The contextual Legend is linked to a diagnostic Key listing 72 Native Trees of Cascadia organized by Families, translating common-language abbreviations used in the Legend—e.g. WRC for Western Red Cedar—into the scientific Thuja plicata; with the distributions on the map, Legend and Key together offer a new level of comprehensive detail for understanding the composition of Cascadia’s forest assemblages on the ground, for comparison of species occurring across differenttypes, as well as shifting floristic geographies, providing another baseline for understanding change.
-
Color Palette: Reserving color here for Vegetation (rather than conventional elevation tints), this map provides a coherent and grounded color palette for Cascadia in terms of (a) intrinsic color (e.g. cinnamon-orange for Ponderosa Pine), (b) distribution along regional gradients of moisture and temperature, (c) figure/field contrasts with adjacent colors, and (d) resonance of the overall color field.(Dialing in “just so” over sixty mutually-influencing colors so they work together part-and-whole was a Herculean task, and offers a new Bioregionally grounded strategy for color palette design).
So, with that in mind, can we follow the subterranean, water and atmospheric pressures and they pour through the boundary, the land surface, that we live on, over time?

Using plant species as indicators?


Yes, we can. I think David McCloskey has given us a great gift with his work: nothing less than the first post-colonial map. He does more with it than I describe here, linking it to both the sea and the mountains, but you should hear about that from him:
It’s exciting to have a map-making strategy that allows one to know one’s way without reference to GPS or paper. What a fantastic synthesis.
Categories: Agriculture, Arts, Ethics, First Peoples, Gaia, Grasslands, Nature Photography, Spirit, Water

Aren’t the earth wind maps glorious!
LikeLiked by 1 person
They are. Do you want the website link?
>
LikeLiked by 1 person
Yes, thanks. The wind takes on a hyper-vigilant persona in those brilliant colours!
LikeLiked by 1 person